Market Report Mobile Conversion
Market Report was desktop-only, forcing dealers to use it in-office. By redesigning for mobile-first dealer use on the lot, we achieved 100% mobile utility and revealed condition data as a strategic differentiator.
60-Second Summary (TL;DR)
- The outcome: Market Report was powerful on desktop but dealers needed insights on the lot, not in the office. By creating a mobile-first experience focused on what dealers actually used, we achieved 100% mobile utility and revealed condition data as a strategic differentiator.
- Why it mattered: Dealers make pricing decisions on the lot in real-time. Desktop-only access meant insights came too late—after conversations were over. Mobile meant decision-making in the moment.
- What I did: Led research to uncover that dealers were overwhelmed by 15+ filters and sorting options. Discovered what mattered: recent comparable sales and vehicle condition. Built a focused mobile experience around those insights.
- Proof: Mobile utility jumped from 0% to 100%. Condition highlights became the most-used feature. Success led to 3 follow-on projects (SAM offers, auto bidding, save search).
The Problem
What everyone thought: Dealers want Market Report on mobile for convenience. Build a mobile version.
What research revealed: Dealers wanted market data on the lot, but not in the form we offered on desktop. The desktop experience had 15+ sorting options and complex filters—all valuable for analysis. On mobile, this was overwhelming noise. Dealers needed one thing: “What did comparable vehicles with matching condition recently sell for?”
Why this mattered: Without mobile access, dealers couldn’t use the tool at the critical moment of decision. Competitors could build better mobile intelligence tools first.
The insight: Design for the specific context of mobile use (on the lot, in conversation, time-constrained). Don’t replicate desktop on mobile. Ruthlessly prioritize relevance over comprehensiveness.
The 3 Decisions That Drove the Outcome
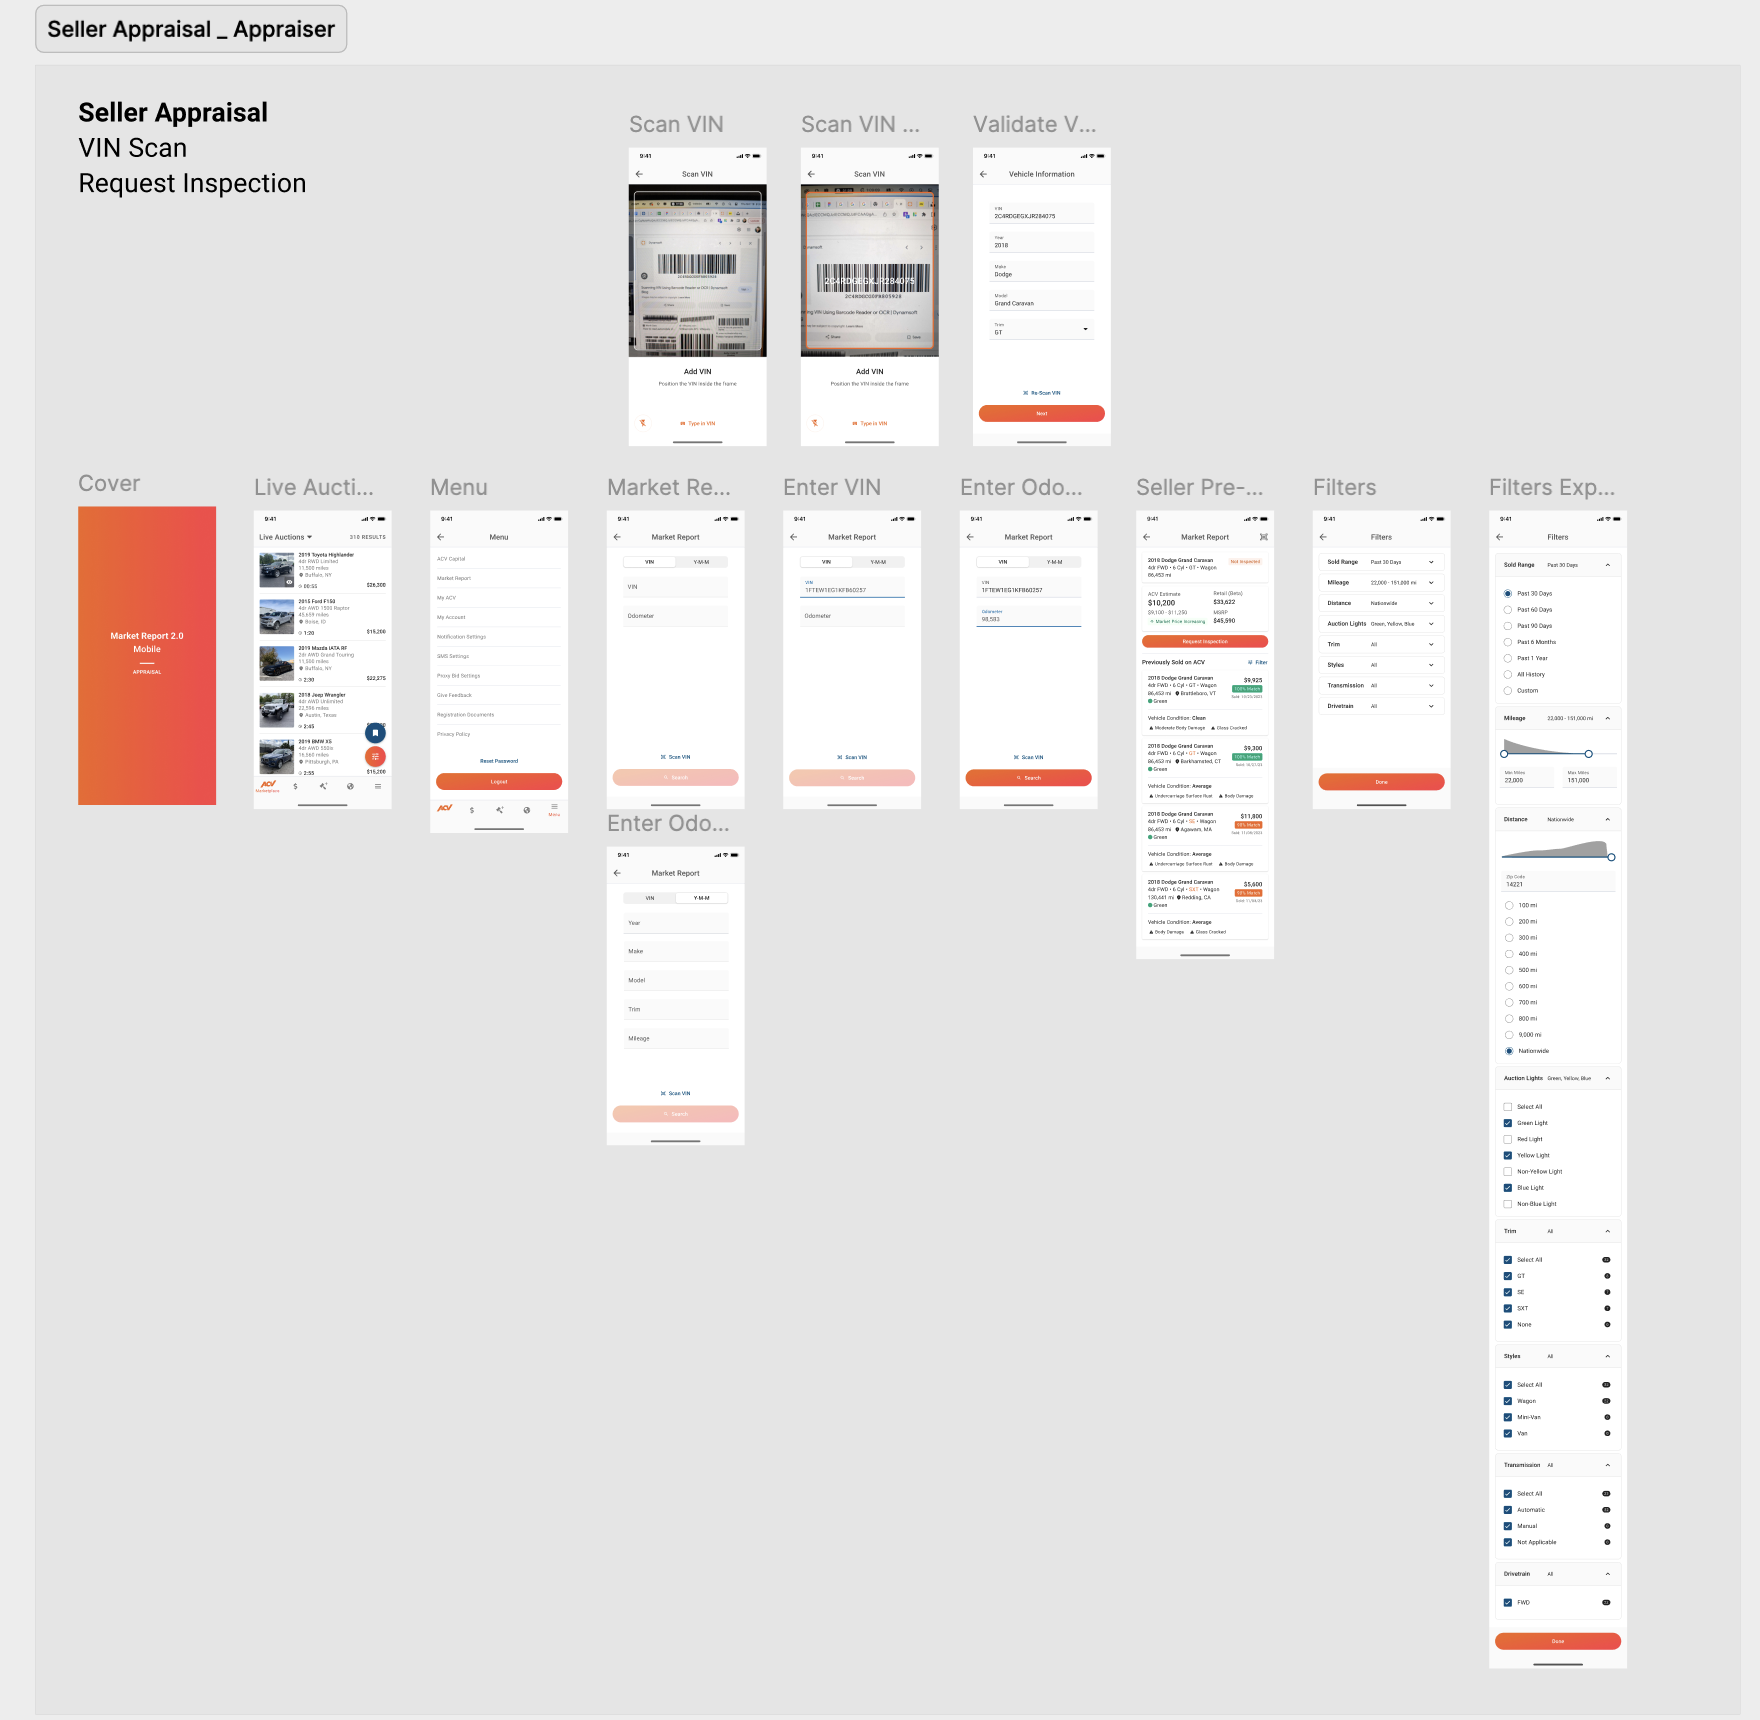
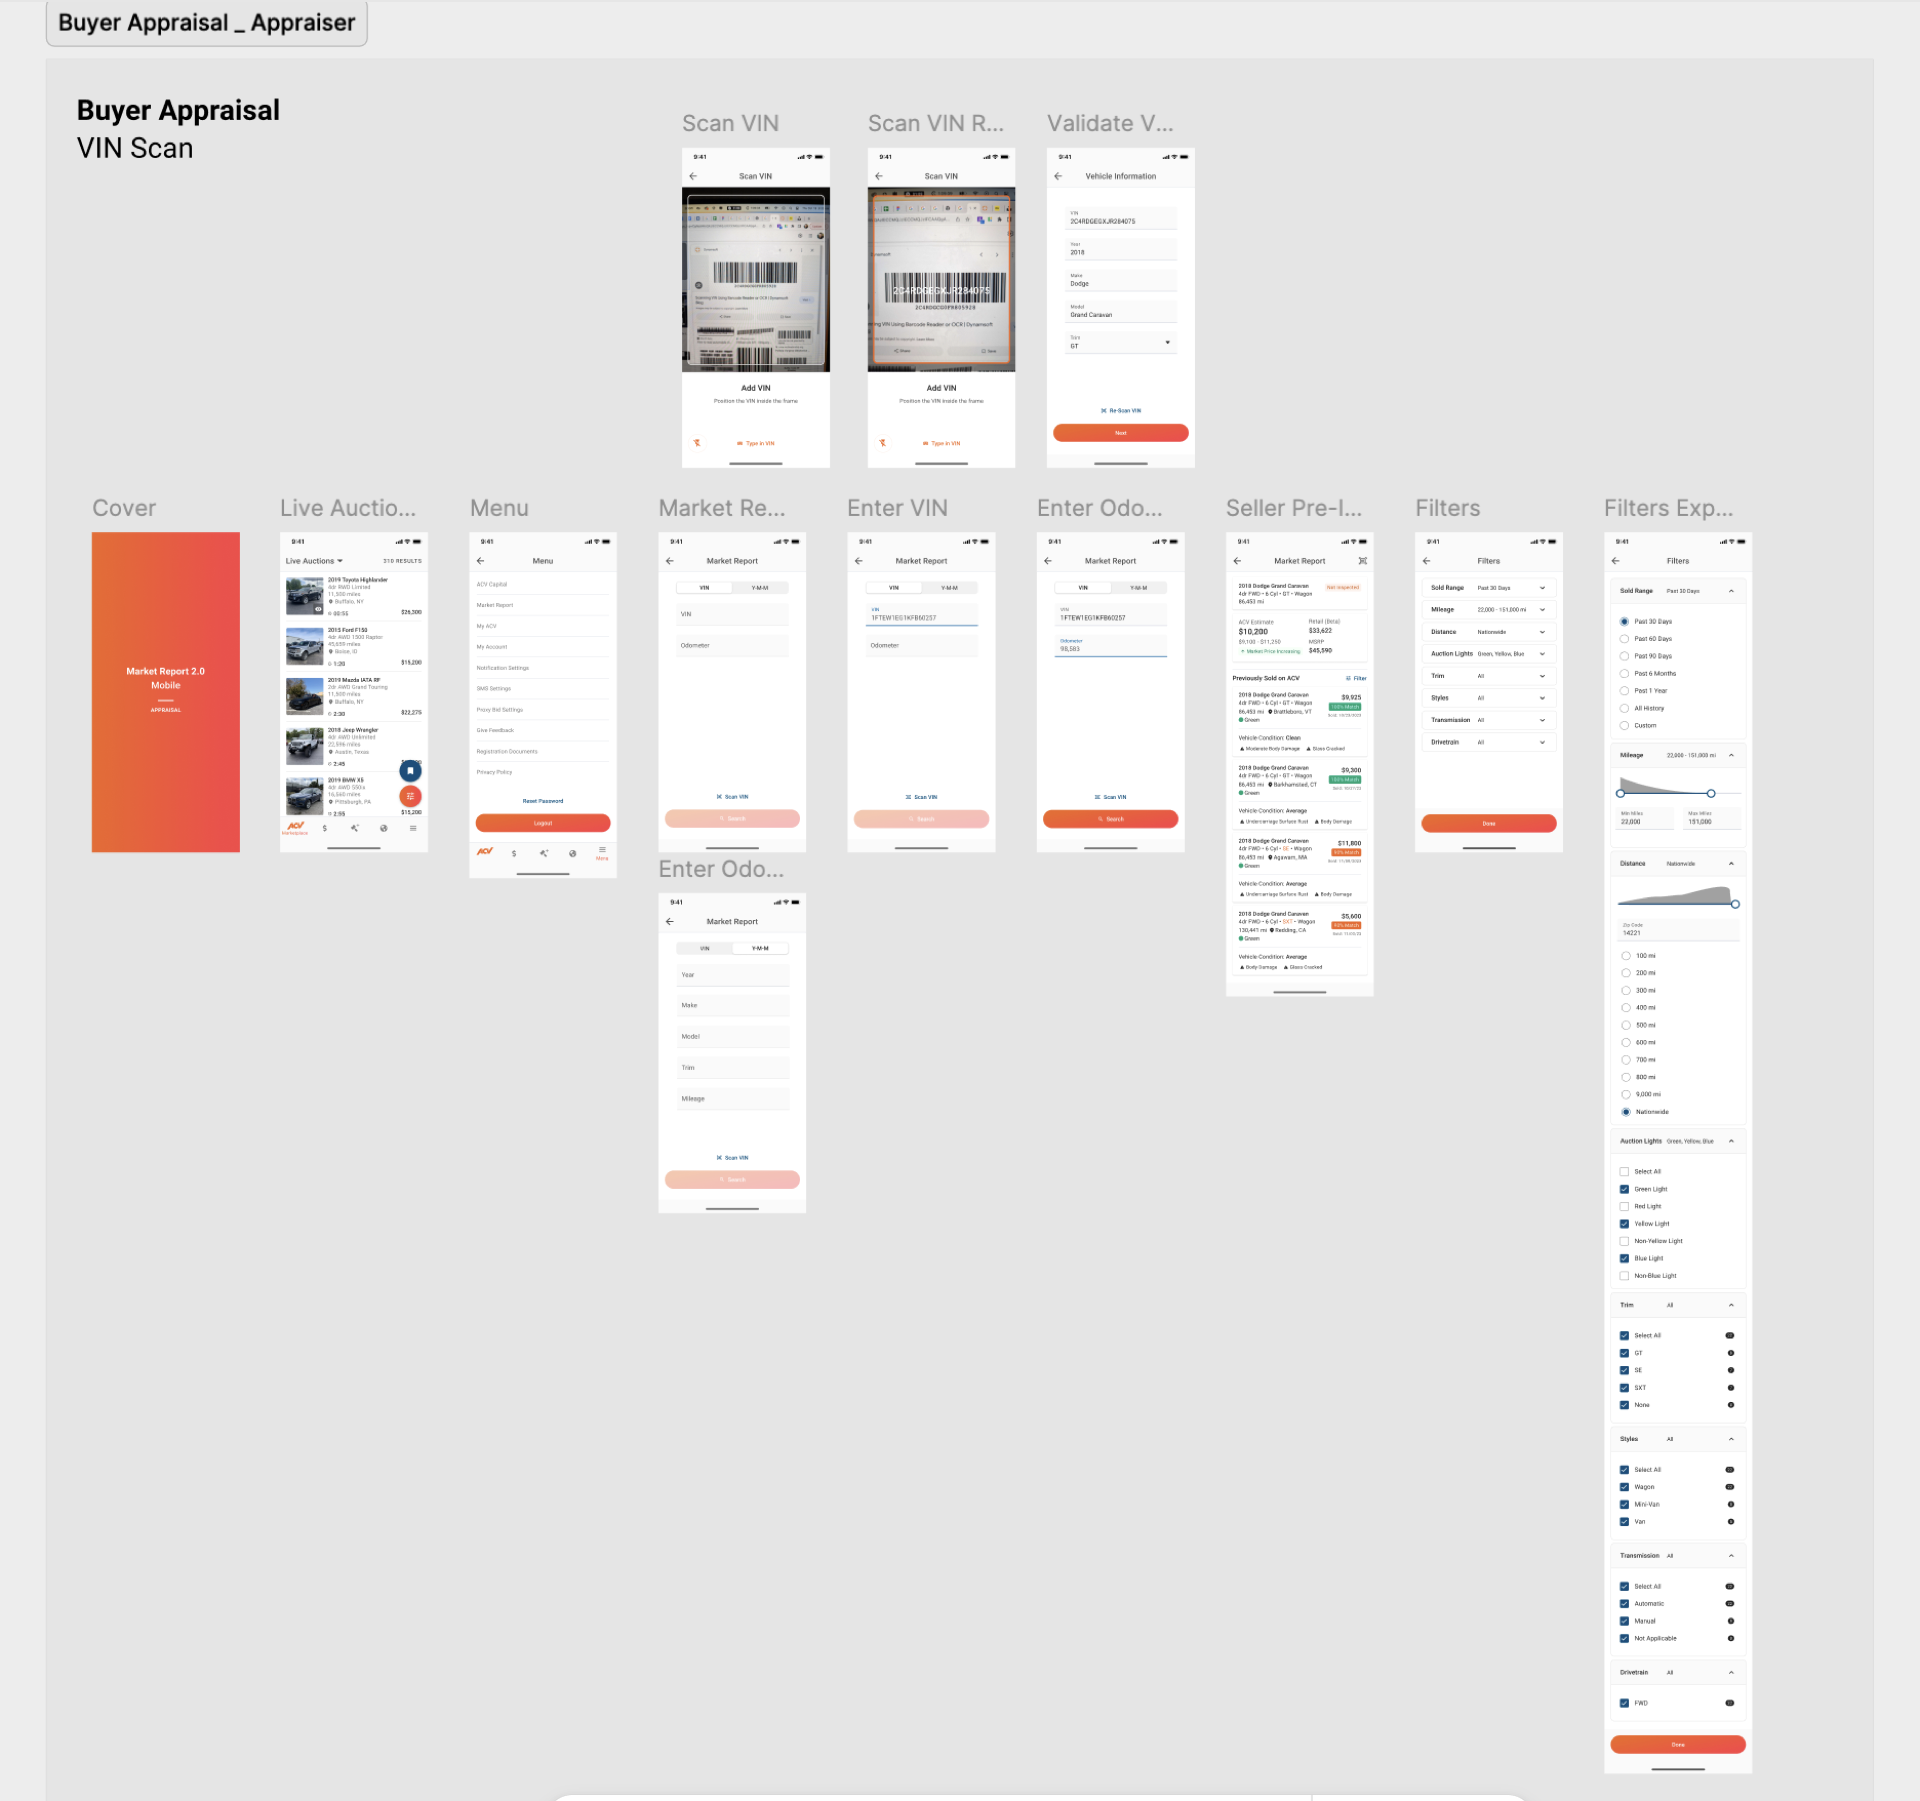
Decision 1: Remove Filters; Focus on What Dealers Actually Used
Problem: Desktop had 15+ sorting and filtering options. Analytics showed dealers used 3–4 regularly. The rest were noise on mobile.
Solution: Remove all filters from mobile. Show 10–15 most relevant comparables (same make/model/trim, sold in last 90 days, sorted by recency). Dealers see signal, not noise.
Impact: Dealers opened the app, saw exactly what they needed, and made a decision in 60 seconds. No cognitive load from choosing filters. The simplicity felt intelligent—the app knew what they wanted to see. Mobile sessions averaged 90 seconds but were high-intent (dealers opened to solve a problem, found the answer, closed).
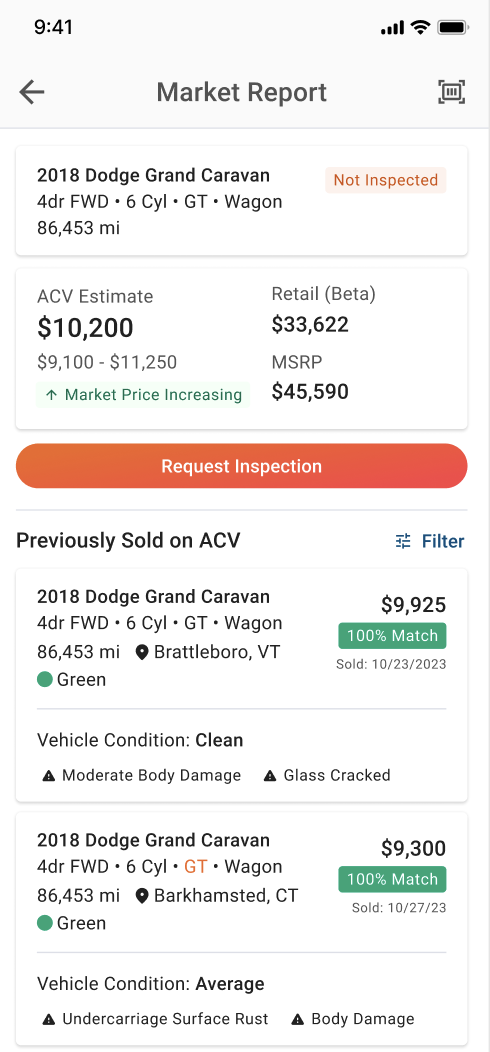
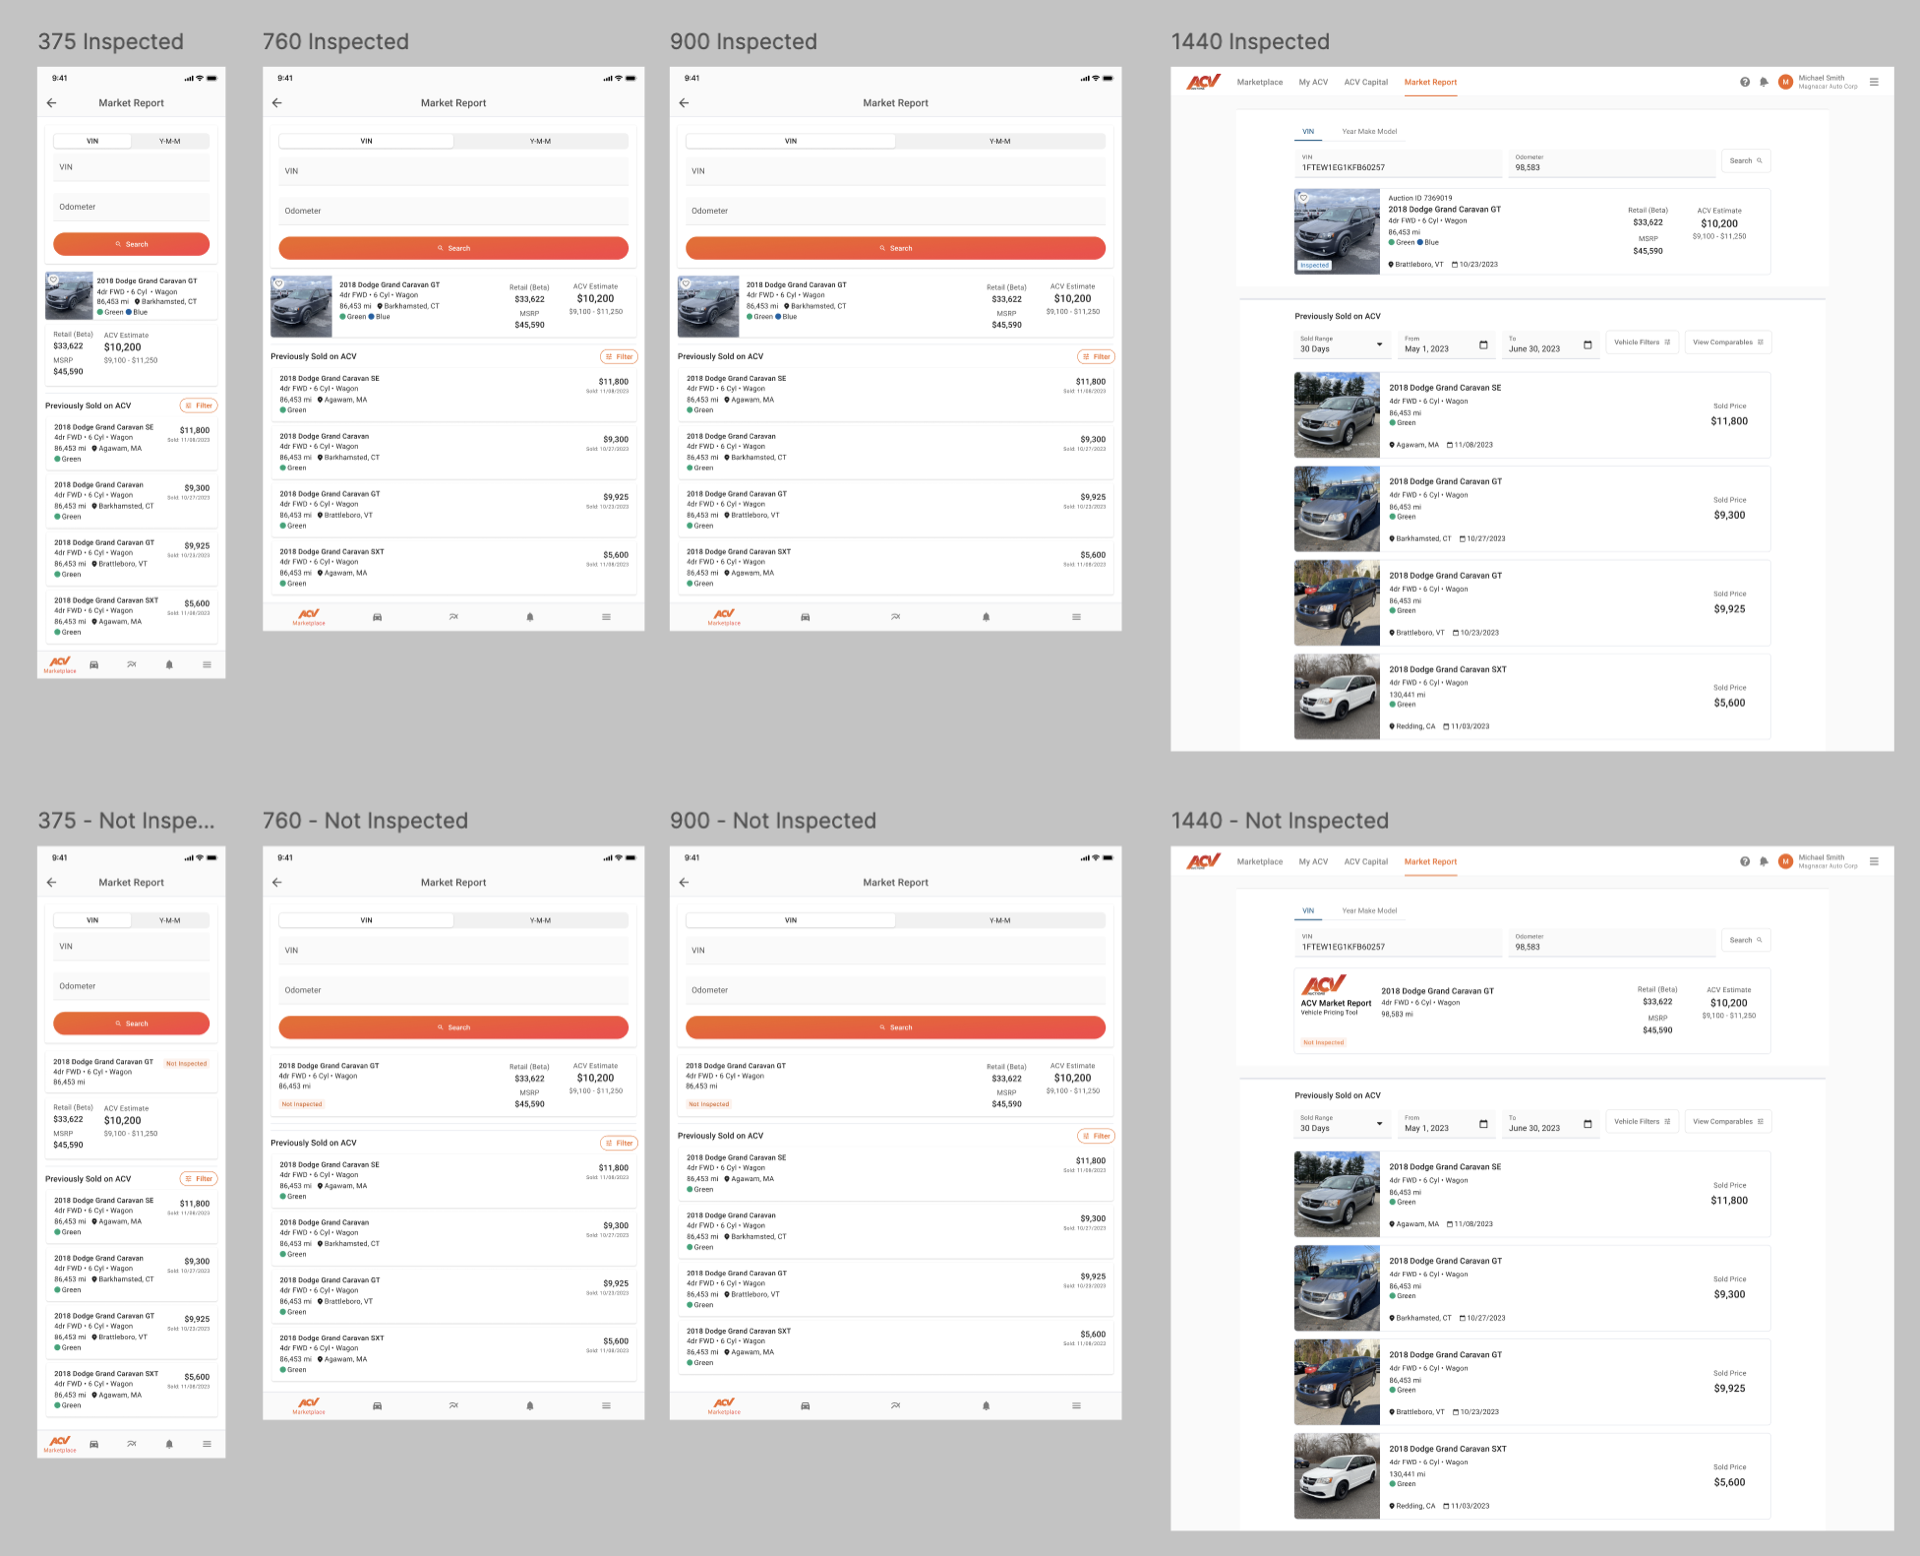
Decision 2: Surface Condition Highlights as Core Feature
Problem: Desktop Market Report showed condition data in a table—one row among many. Dealers were obsessed with condition: “If I can see that three vehicles with matching damage sold for $3K less, I know I’m overpriced.” But the signal was hidden.
Solution: Embed condition highlights directly in each vehicle result as visual badges. Aggregate across comparables to show patterns (“3 of 5 vehicles with matching paint damage sold for $2.5K–$3K below asking price”).
Impact: Dealers could see condition patterns at a glance without clicking. The visual encoding made insights immediate and actionable. Condition highlights became the most-used feature on mobile. Dealers mentioned it in feedback: “This is exactly what I needed.” The feature was so valuable it was later integrated into SAM offers and auto bidding.
Decision 3: Design for One-Handed Use and 2-Minute Sessions
Problem: Desktop Market Report was designed for seated analysis. Mobile dealers on the lot are standing, holding keys or clipboards, with ~2 minutes to decide.
Solution: Design a single-screen interface showing all key data at once. Large touch targets. Primary action (compare vehicle value) requires only one tap. No navigation needed for the core use case.
Impact: Dealers could open the app with one hand, tap vehicle details, compare to comparables, and decide—all without complex interactions. The simplicity made the tool feel designed for their specific moment. Dealers reported using Market Report with one hand while walking the lot or in conversation with buyers.
Evidence and Results
Quantitative:
- Mobile utility: 0% (before) → 100% (now significant % of Market Report usage is mobile)
- Engagement: High session frequency, short sessions (90 seconds average), high action rate
- Condition highlights: Most-used feature on mobile; dealers spend 3x more time on vehicles with condition data
- Follow-on demand: Success led to 3 follow-on projects (SAM offers, auto bidding, save search)
Qualitative:
- Dealer feedback: “This is exactly what I need on the lot” and “Condition highlights are a game-changer”
- Analytics: Mobile usage patterns aligned perfectly with on-the-lot use case hypothesis
- Leadership: Market Report Native success justified continued mobile intelligence investment; became strategic priority
What This Unlocked
- Immediate: SAM offers, auto bidding, and advanced save search were green-lit based on mobile demand proof
- Pattern established: Market Report Native became the template for mobile-first design on the vehicle intelligence team
- Data as design: Demonstrated that surfacing the right data in the right way (condition patterns as visual badges) creates features that feel intelligent
- Follow-on projects: All three successor projects (SAM offers, auto bidding, save search) were built on the mobile market data foundation
Reflection
Key insight: Mobile doesn’t mean “make it smaller”—it means “redesign for the specific context.” Mobile Market Report succeeded not because it had more features, but because it had fewer, better-prioritized features.
How it changed my approach: I now ask “What is the dealer trying to do on mobile that’s different from desktop?” before designing. Mobile and desktop are different contexts requiring different solutions, not responsive versions of each other.
Problems I now look for: Situations where the same product is used differently on different platforms. These are opportunities for context-specific optimization that create disproportionate value.
Appendix
Supporting artifacts:
- 18 dealer interviews on mobile Market Report needs and on-the-lot use cases
- Feature usage analysis: Analytics showing only 3–4 of 15+ desktop filters were actually used
- Mobile usability testing: Testing with dealers on the lot, one-handed, time-constrained
- Condition data schema: Mapping damage types to visual badges
- Mobile design system: Touch targets, one-handed interaction patterns, single-screen interface
Related work:
- SAM offers: Built on market data foundation; used condition highlights to inform pricing
- Auto bidding: Leveraged comparable data and condition patterns for bid strategies
- Advanced save search: Extended condition highlighting to enable condition-based filters